
Modern digital systems are becoming increasingly complex. Microservices architectures, cloud-native environments, containers, APIs, and Generative AI–based applications have pushed IT ecosystems far beyond the capabilities of traditional monitoring.
The challenge is that many organizations still rely on conventional monitoring tools that answer only one question: “What is broken?”
They fail to address far more critical questions: “Why did it break, where is the root cause, and how does it impact users and the business?”
This is where Elastic Observability comes in, offering a new approach that helps IT, DevOps, and SRE teams gain a holistic understanding of their systems, from technical root causes to real user experience.
Why Traditional Monitoring Is No Longer Enough for Modern Systems
Traditional monitoring is typically siloed. Logs, metrics, and alerts are monitored separately, often without shared context. As a result, when incidents occur, teams must jump between multiple tools just to piece together what actually happened.
In fast-moving modern environments, this approach leads to:
- Longer troubleshooting times
- Alert fatigue without meaningful context
- Direct negative impact on user experience and revenue
Observability does not replace monitoring, it enhances it by adding context, correlation, and actionable insights.
Observability Challenges in the Era of Microservices, Cloud, Containers, and AI Applications
Modern architectures introduce challenges that legacy approaches cannot handle:
- Distributed systems → a single request may traverse dozens of services
- Fragmented data → logs, metrics, traces, and user experience data live in different places
- AI and LLM-based applications → latency, errors, and usage costs are difficult to track
- Dynamic scale → containers and serverless resources constantly change
Without proper observability, teams see only fragments of the system and often realize user impact too late.
Elastic Observability: Not Just “What Happened,” but “Why It Happened”
Elastic Observability is designed to answer the questions traditional monitoring cannot.
Within a single unified platform, Elastic Observability enables organizations to:
- Connect data from multiple sources
- Identify root causes faster
- Understand technical and business impact simultaneously
Through Observability AI, Elastic goes beyond visualizing data by automatically analyzing and interpreting it.
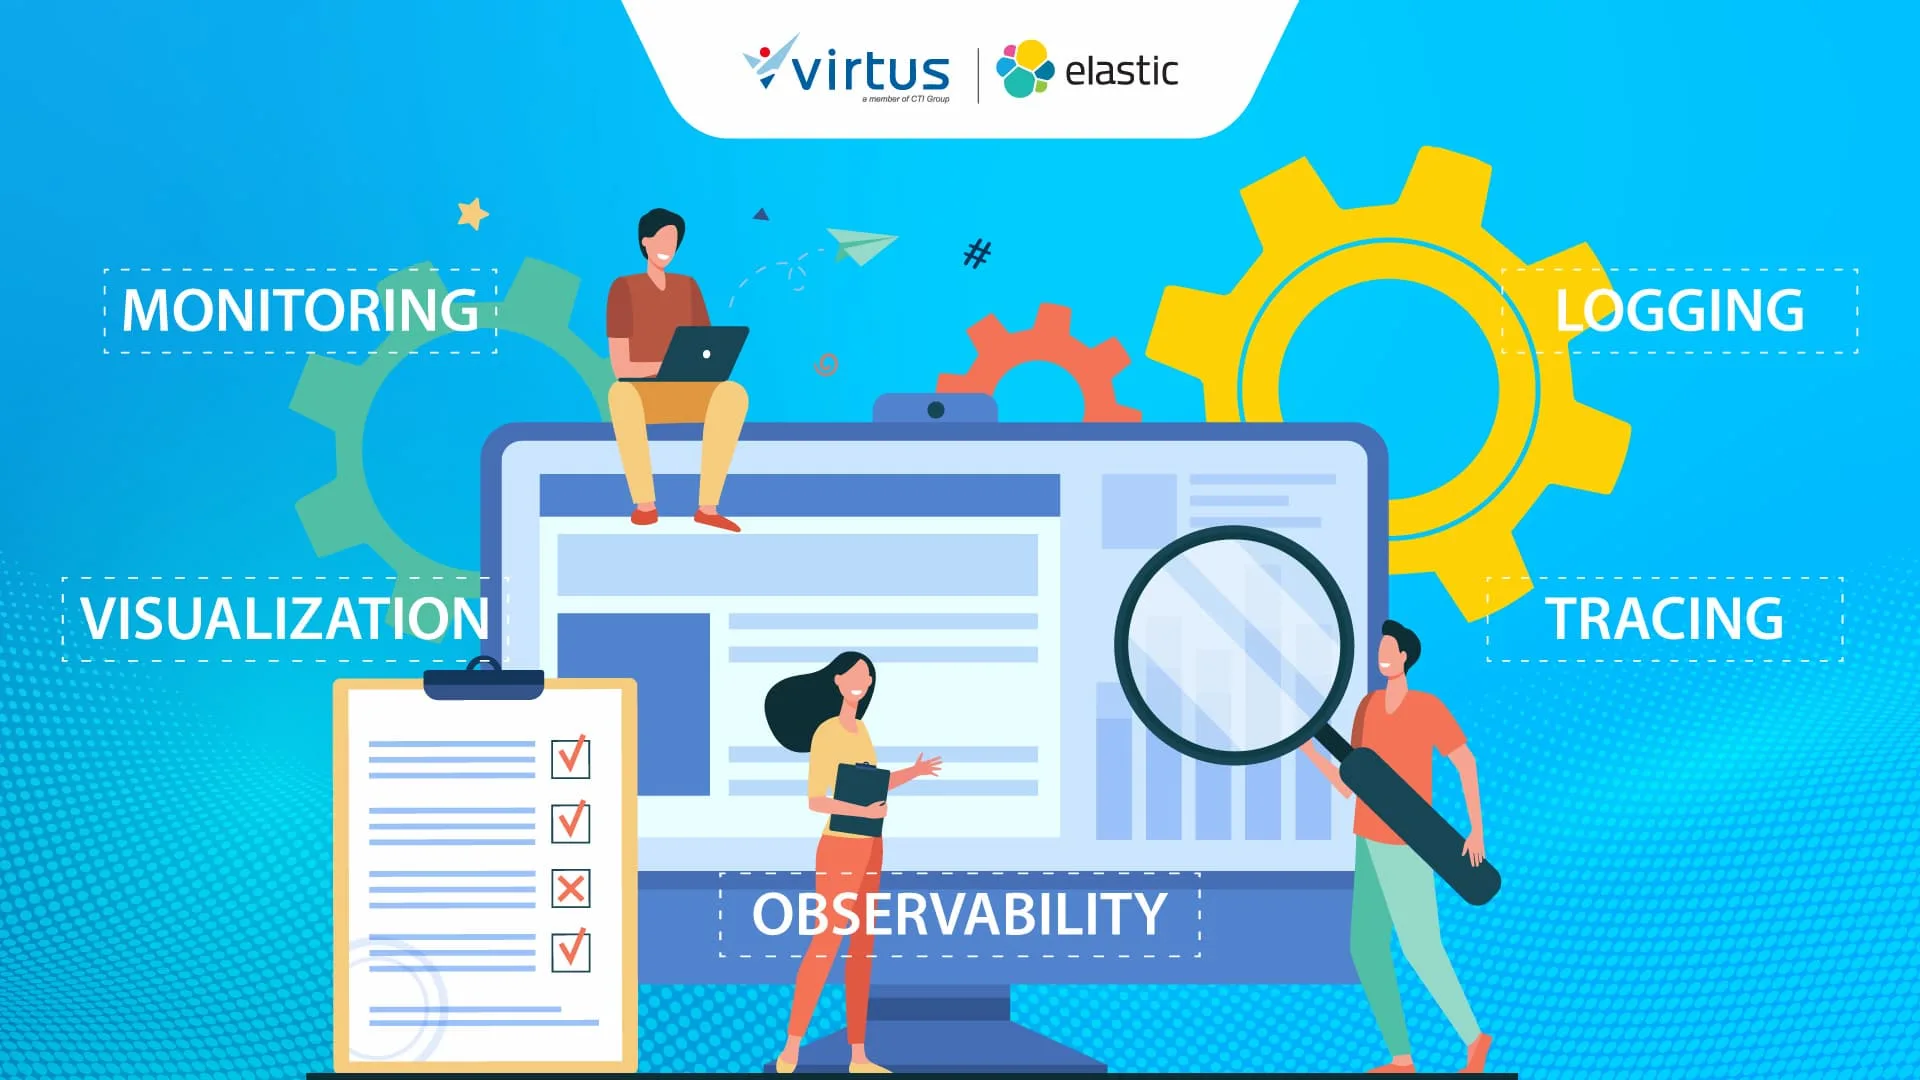
What Is Elastic Observability?
Elastic Observability is an open-source–based observability solution that helps IT and engineering teams fully understand system health, not just see errors or alerts.
Unlike traditional monitoring, Elastic Observability unifies all critical data, logs, metrics, traces, and digital experience data, into a single, flexible, and scalable platform.
Its core principle is simple: Bring your data. We’ll do the rest.
No matter the data source, cloud, on-premises, containers, or AI applications, Elastic collects, correlates, and transforms data into clear, actionable insights.
How Does Elastic Observability Work?
Unifying Logs, Metrics, and Traces in One Platform
The first step is eliminating data silos.
Elastic collects and correlates all observability signals in a vendor-neutral, fully OpenTelemetry-compliant manner, eliminating the need to switch between tools. The result is a single source of truth for understanding system behavior.
Application Performance Monitoring (APM)
With data connected, Elastic APM provides end-to-end visibility into application performance.
Latency, errors, and service dependencies can be traced down to the code level, enabling developers and DevOps teams to pinpoint issues quickly without guesswork.
Infrastructure Monitoring
Elastic Observability extends visibility across infrastructure.
From bare metal and virtual machines to Kubernetes and serverless environments, everything can be monitored in a unified view with more than 400 out-of-the-box integrations. Teams can immediately determine whether issues originate from applications, resources, or infrastructure configuration.
Log Monitoring
Logs are often the most detailed, but also the most complex source of information.
Elastic can process petabytes of log data at speed, with real-time search, prebuilt dashboards, and flexible queries using ES|QL. This transforms raw log data into clear, relevant insights.
Digital Experience Monitoring
Elastic Observability goes beyond technical metrics.
Through Real User Monitoring (RUM), Synthetic Monitoring, and Uptime Monitoring, teams can understand how system performance is experienced by end users, from page load times to user interaction flows.
AIOps in Elastic Observability
To accelerate analysis, Elastic delivers AIOps with zero-configuration, always-on intelligence.
The platform automatically detects anomalies, uncovers hidden patterns, correlates signals, and highlights potential root causes, without complex manual rules.
LLM Observability
Elastic Observability is built for the AI and Generative AI era.
Teams can monitor LLM-based applications, tracking latency, errors, prompts, responses, usage, and cost, ensuring AI applications remain performant, reliable, and cost-controlled.
Why Elastic Observability Outperforms Traditional Monitoring
Elastic Observability delivers distinct advantages:
- Observability AI → automated insights, not just raw data
- Open and extensible → API-driven, flexible, and vendor-neutral
- Cost-efficient → high-performance storage without compromising data retention
- Built for practitioners → designed for DevOps, SRE, and engineering teams
As a result, issues that once took hours to analyze can now be resolved in minutes.
Also Read: Optimizing IT Infrastructure with Observability for Better Performance
End-to-End Enterprise Observability with Virtus
Virtus Technology Indonesia (part of CTI Group) delivers Elastic Observability to help organizations achieve complete system visibility, from data ingestion to AI-driven insights.
Backed by Elastic’s global technology and local expertise that understands enterprise needs in Indonesia, Virtus ensures observability implementations that are scalable, secure, and ready for modern system complexity.
Build more reliable, responsive, and user-centric systems with Elastic Observability and Virtus. Contact our team today for a consultation and demo.
Author: Ary Adianto
Content Writer, CTI Group